Exponential functions are a fundamental concept in mathematics, representing growth or decay that increases or decreases rapidly over time. Graphing these functions helps us visualize how they behave and understand their properties. In this worksheet, we will explore how to graph exponential functions and interpret their graphs.
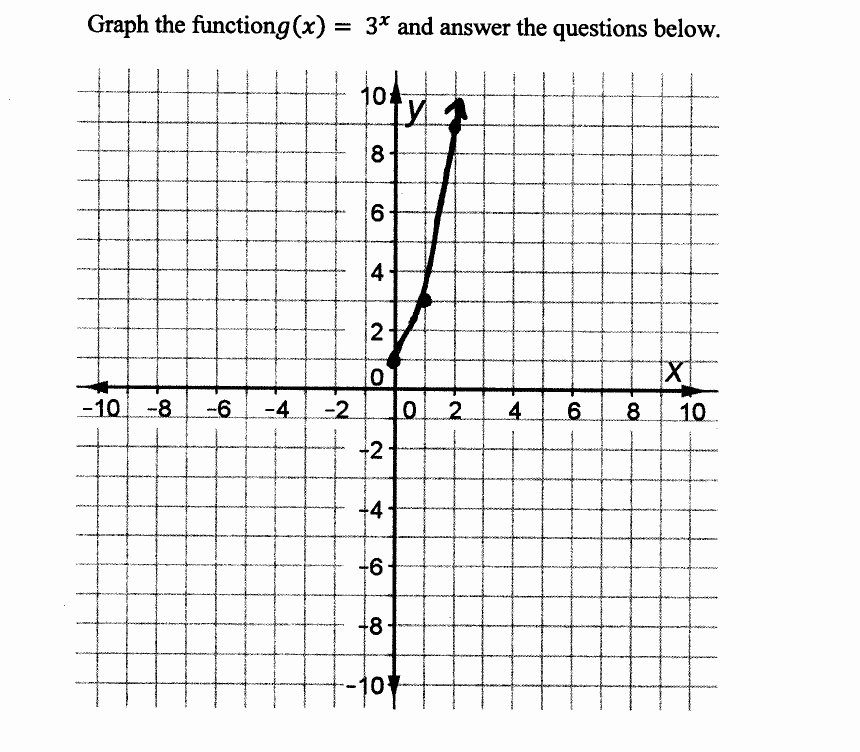
When graphing exponential functions, it is essential to understand the basic form of these functions: f(x) = a*b^x, where ‘a’ is the initial value or y-intercept, and ‘b’ is the base of the exponential function. The base ‘b’ determines the rate of growth or decay of the function. To graph an exponential function, we can choose a few x-values, calculate the corresponding y-values using the function, and plot the points on a coordinate plane.
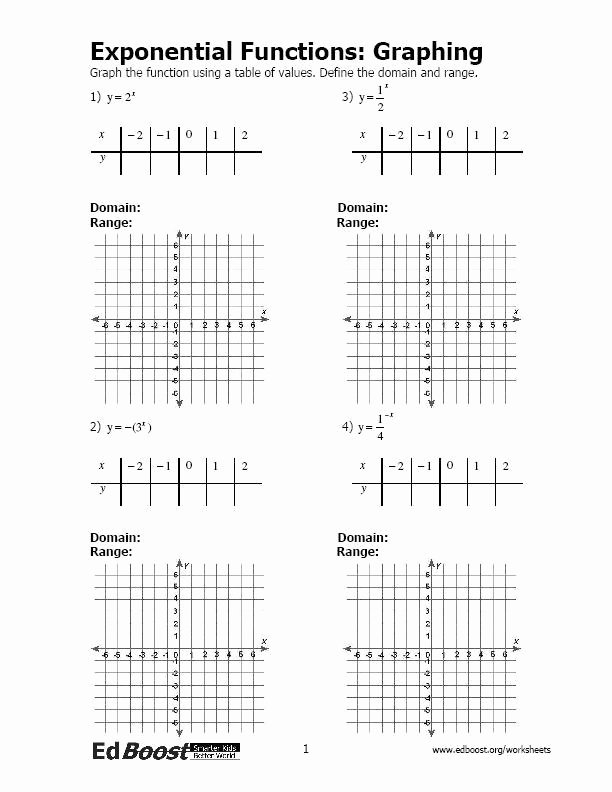
For example, let’s consider the function f(x) = 2^x. To graph this function, we can select x-values such as -2, -1, 0, 1, and 2. Calculating the corresponding y-values, we get f(-2) = 1/4, f(-1) = 1/2, f(0) = 1, f(1) = 2, and f(2) = 4. Plotting these points on a graph, we see that the exponential function grows rapidly as x increases.
Exponential functions also exhibit certain characteristics on their graphs. For functions with a base greater than 1, the graph will be increasing from left to right, showing exponential growth. On the other hand, functions with a base between 0 and 1 will exhibit exponential decay, decreasing from left to right. The y-intercept of the function represents the initial value or starting point of the exponential growth or decay.
It is important to note that exponential functions never cross the x-axis, as they continue to increase or decrease indefinitely. The rate of growth or decay, determined by the base ‘b’, influences the steepness of the graph. Understanding these properties helps us interpret the behavior of exponential functions and make predictions about their future values.
In conclusion, graphing exponential functions provides valuable insights into their behavior and properties. By plotting points on a graph and observing the patterns, we can visualize how these functions grow or decay over time. Understanding the basic form of exponential functions and their characteristics on graphs is essential for solving problems and making informed decisions in various fields of study.

